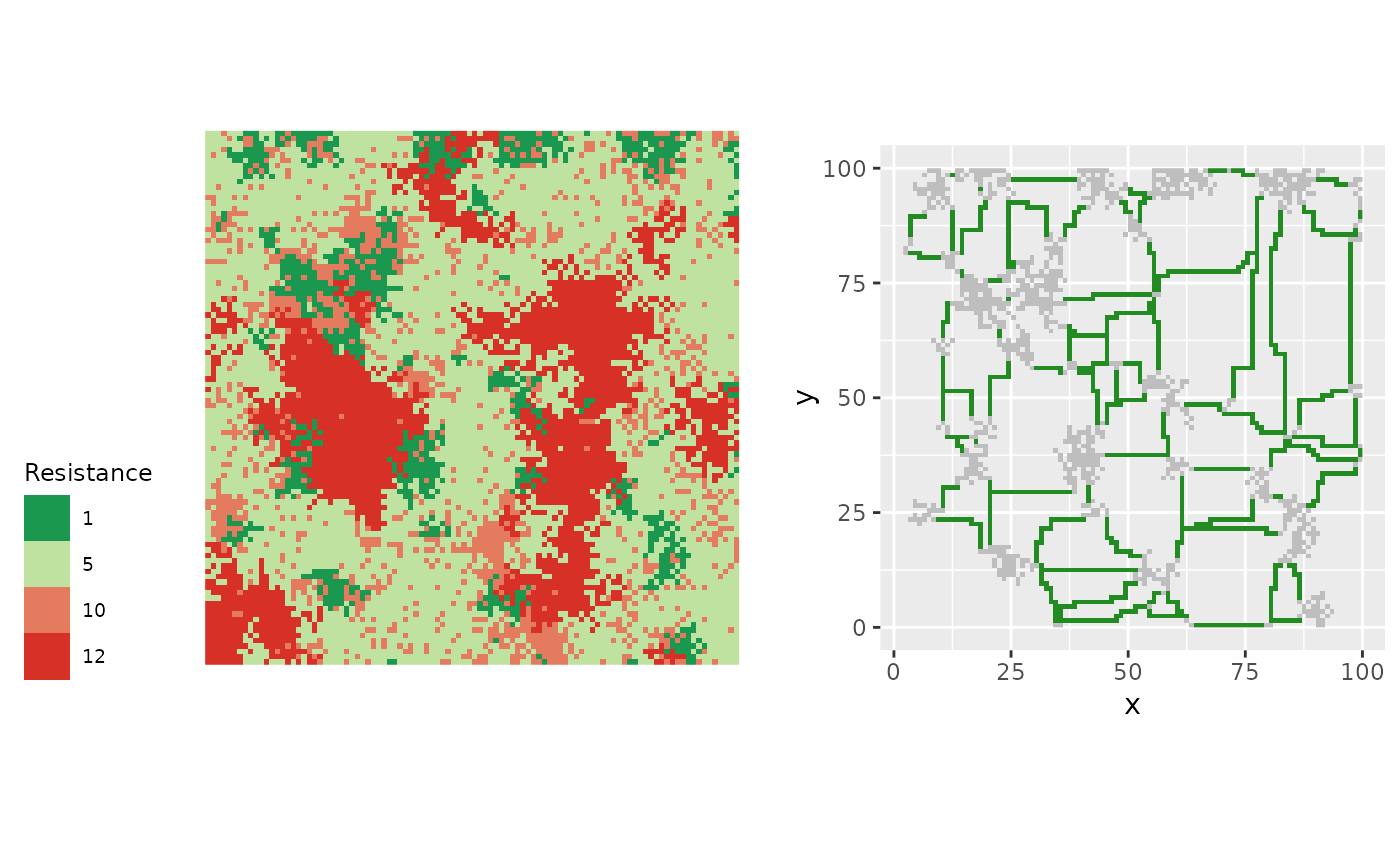
Places a resistance-surface reference panel (see plotResistance()) to the left of a
network plot – for example one produced by plot() on an mpg or grain object, or
any ggplot2 plot – so the two can be compared at the same size as a visual
sanity check. Both panels are drawn at equal size (using cowplot::plot_grid() with
align = "h" and equal coordinates) and the resistance legend is placed at the far
left.
Requires the cowplot package.
Arguments
- x
A resistance
SpatRastershown as the reference panel on the left (passed toplotResistance()).- gg
A plot shown on the right, e.g. the result of
plot()on anmpgorgrainobject (typically withtheme = FALSE), or anyggplot2::ggplot()object.- maxResistance
Passed to
plotResistance().
Value
A two-panel plot grid produced by cowplot::plot_grid().
Examples
# \donttest{
if (requireNamespace("cowplot", quietly = TRUE)) {
tiny <- terra::rast(
system.file("extdata", "tiny.asc", package = "grainscape", mustWork = TRUE)
)
tinyCost <- terra::classify(tiny, rcl = cbind(c(1, 2, 3, 4), c(1, 5, 10, 12)))
tinyMPG <- MPG(tinyCost, patch = tinyCost == 1)
plotWithResistance(tinyCost, plot(tinyMPG, quick = "mpgPlot", theme = FALSE))
}
 # }
# }