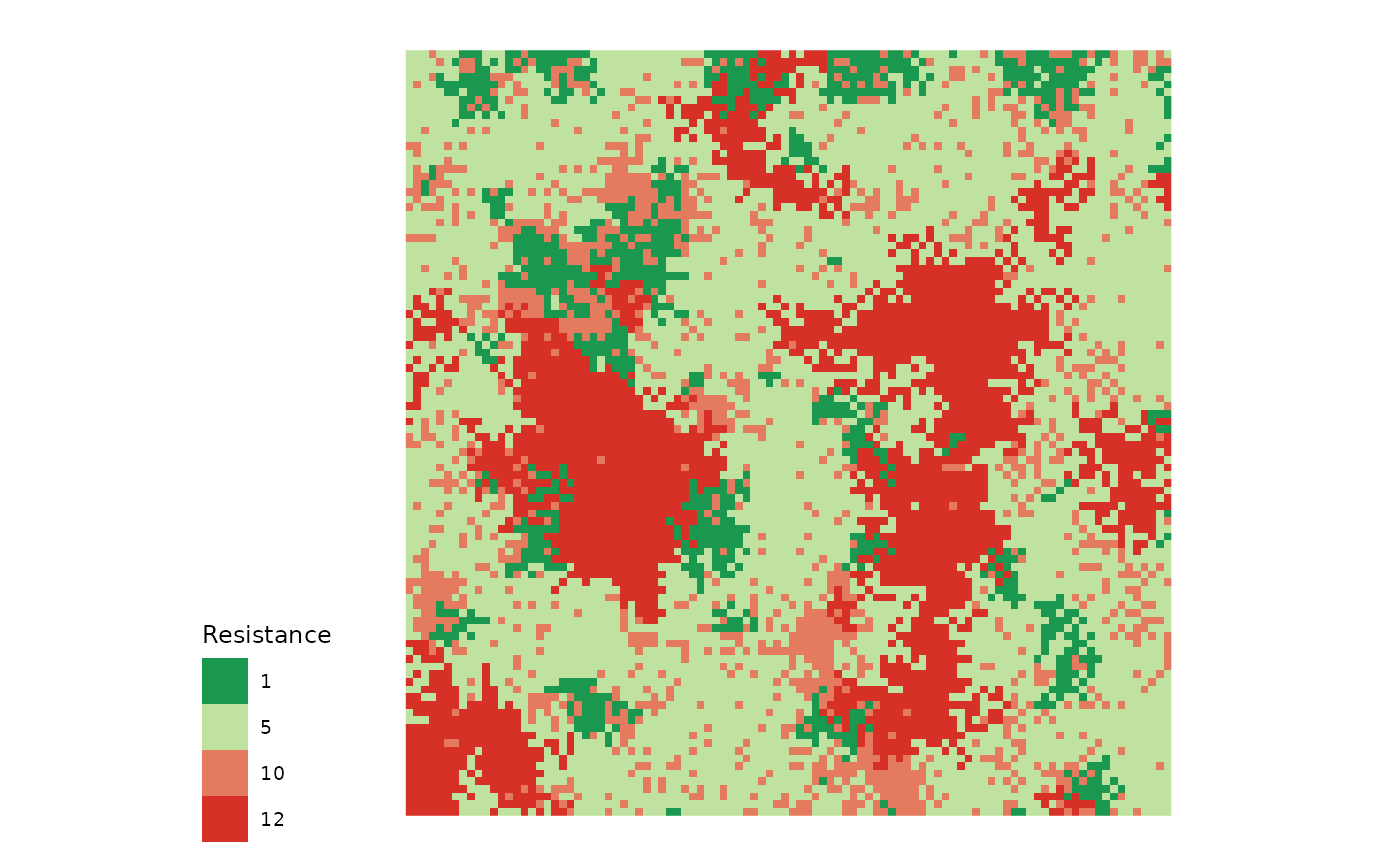
Plot a resistance surface with a consistent colour scheme
Source:R/plotResistance.R
plotResistance.RdDraws a resistance SpatRaster using a shared colour scheme (green for low
resistance through red for high resistance) with a discrete-swatch legend placed to
the left of the panel. Each resistance value is mapped to a fixed colour so that the
same value appears identical across figures, which is useful when comparing several
landscapes or when pairing a resistance surface with a network plot (see
plotWithResistance()).
Arguments
- x
A resistance
SpatRaster, e.g. thecostsurface passed toMPG().- maxResistance
Integer. The resistance value mapped to the top (red) end of the colour ramp; values from
1tomaxResistancereceive fixed colours so the scheme stays consistent across surfaces. Defaults to12, and is automatically raised to the largest value present inxif that exceeds it.
Value
A ggplot2::ggplot() object.